
AWARDEES: Miguel O. Román, Eleanor Catherine Stokes, Zhuosen Wang, Virginia Kalb, Ranjay Man Shrestha
FEDERAL FUNDING AGENCIES: NASA
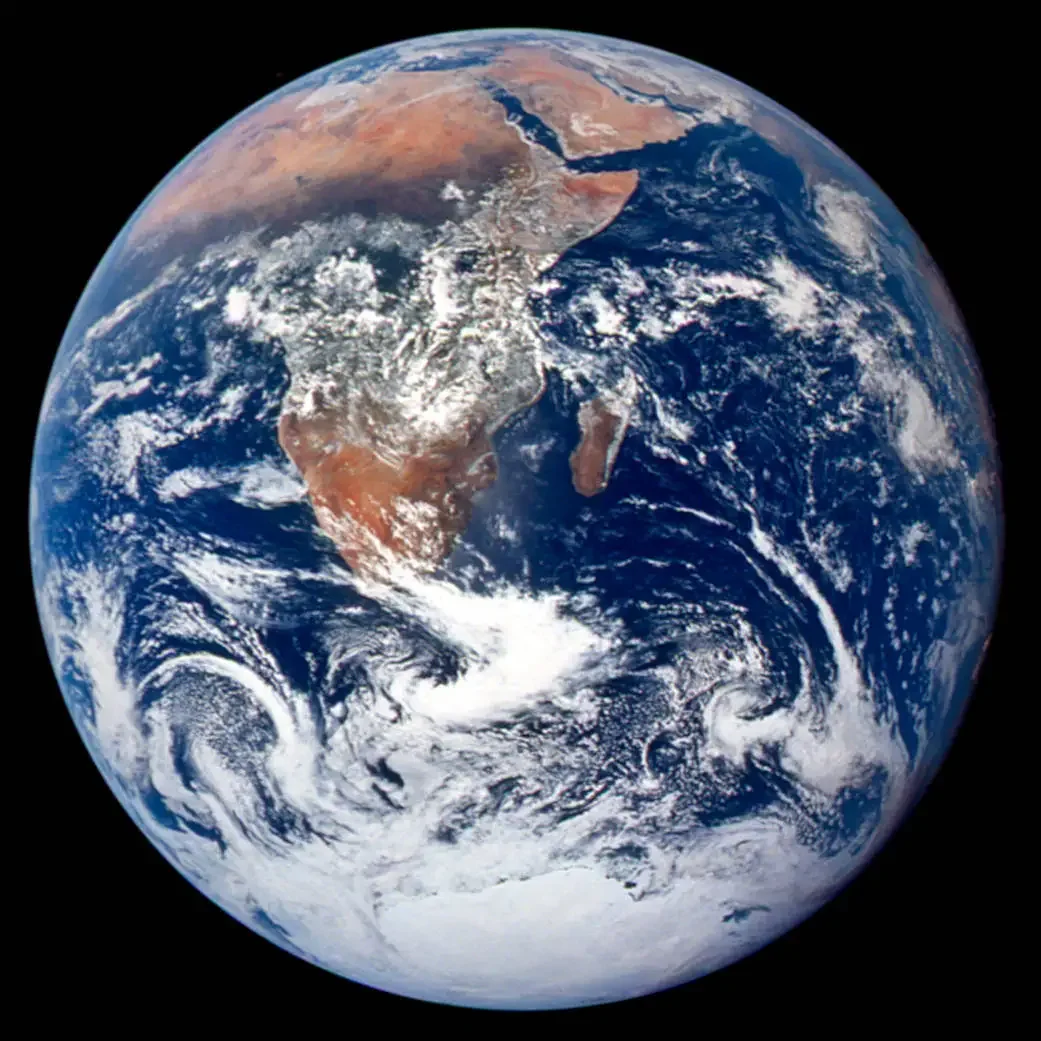
Blue Marble (Apollo 17, NASA)
The iconic image “Blue Marble” was captured on December 7, 1972, by the crew of Apollo 17 as they traveled to the moon. One of the first clear images of Earth nearly fully illuminated by daylight, the Blue Marble inspired generations of humans to look back at their home as awe-inspiring, sublime. Over the years, satellite imagery of Earth has revealed a wealth of information that has changed how we track weather, plan agriculture, and navigate the world. Earth at night, however, has been more difficult to study.
This is a story about a satellite sensor meant to detect faint clouds at night, which happened to spot unexpectedly bright city lights. But more importantly, it’s the story of NASA researchers who saw the potential in an unforeseen discovery — and whose vision resulted in a powerful Earth science tool to support near real-time disaster response and recovery, public health decision making, energy analysis, and humanitarian relief.

Miguel Román
An Unexpected Path to NASA
Miguel Román never imagined he’d lead a team of NASA researchers. Born in Puerto Rico, Román’s understanding of a successful future involved studying to become an engineer and working as a line manager for a local biotech company or Bacardi Rum. But a college internship in 2003 at NASA’s Goddard Space Flight Center opened the aperture of possibilities for Román — there, he saw passionate scientists whose work was directly updating the textbooks he’d read as a child. Goddard supported Román with research fellowships to finish his Ph.D. in satellite remote sensing, a field of study that uses satellite sensors to observe and collect information about Earth from space. Román returned to work at Goddard as a research scientist in 2009, right on the cusp of new technology that would change the field of satellite-based Earth observation.

Eleanor Stokes
In 2009, the Visible Infrared Imaging Radiometer Suite (VIIRS), pronounced “veers,” was gearing up for flight aboard the Suomi National Polar-orbiting Partnership (NPP) satellite, a joint NASA and National Oceanic and Atmospheric Administration mission launched in 2011. VIIRS was a cutting-edge meteorological monitoring system. One component of the VIIRS sensors, the “Day/Night Band,” was designed to adjust to both bright and dim light levels. This meant it could capture daytime observations but also detect faint light on Earth at night. Researchers thought the Day/Night Band could possibly do some nighttime weather tracking, but few had considered its potential for measuring human activity at night.
Eleanor Stokes, a Goddard intern and Ph,D. student at Yale University at the time, remembers standing at the whiteboard with Román, hypothesizing about what they could perhaps see at night with these instruments. Though the VIIRS project was mainly aimed at observing clouds, they thought it could probably see cities, a topic of interest for Stokes, who had a background in engineering and architecture. And if they could capture the light from cities at night via VIIRS, perhaps they could get information about how they changed and grew over the course of years.
Earth at Night
Nighttime Earth observation is difficult. Scientists need very sensitive instruments to detect the small amount of light available for imaging after dark. The Operational Linescan System (OLS) on the Defense Meteorological Satellite Program (DMSP), a pioneering nighttime observation system developed by the U.S. Air Force, faced many constraints that limited the amount and quality of information it could collect. First launched in the mid-1960s, the classified program used moonlight reflected from clouds to capture images of cloud cover, providing information for military operations. In 1972, the program was declassified, and researchers later reported that the system could also capture low-light imaging of Earth at night, including city lights, gas flares, and wildfires.
However, only large-scale changes, like the boundary between farmland and urban areas or a major citywide blackout, could be detected. Resolution, the amount of detail in an image, was limited. Most DMSP observations had a spatial resolution in which each pixel represented an area a little over a mile and a half long. Sensitivity was also a challenge. Because the sensors were solely configured to collect the tiny amount of light reflected from moonlit clouds, bright light sources such as cities often appeared very saturated, making it impossible to distinguish small variations in brightness. Although additional satellites were added to the fleet over time, sensors weren’t consistently calibrated across the satellites, making it extremely difficult to compare observations of the same location day to day with precision.
Clouds also got in the way, often blocking out light from cities. The solution was to make annual composites of images, piecing together the non-cloudy areas of the images to create a completely cloud-free image. This was useful for a full scan of Earth but could not show changes over shorter periods of time.
DMSP produced groundbreaking information about Earth’s nighttime lights, but its usefulness was constrained by limitations in data quality, consistency, and accessibility. VIIRS presented an opportunity to overcome these challenges, although significant work remained to realize its full potential.
Calibration, Validation, and Celebration
Setting up a new instrument on a satellite is fairly involved, and Román was tasked with calibration and validation. Calibration entails comparing an instrument’s measurements against accurate references to determine whether the sensor is measuring light correctly and consistently. Validation provides the next check: determining whether the data accurately represent conditions on Earth.
That work is essential. If researchers observe a city becoming brighter or darker, they need to be sure that something actually changed on the ground, rather than in the sensor or the atmosphere.
So Román hit the books, where he learned that the best way to calibrate VIIRS would be to point the sensor at a place that didn't change much from season to season, like a desert or the moon. That way, if the sensor’s data identified changes in light levels, he would know it was due to the instrument, not the location itself. The Sahara Desert fit the bill: a huge, dry region with uniform sand, few plants, and very little rainfall, so relatively few clouds would block the view. The only other source of light came from cities around the region. Based on previous nighttime light research, the scientists thought city light would be consistent day to day and night to night.
So, when they looked at the initial data coming in from VIIRS, Román and Stokes expected relatively stable light levels over time. Instead, they saw massive variations in the nighttime lights during particular months — sometimes increasing by more than 50% compared to other periods of the year. “We thought the instrument might be broken,” remembers Román.
Before throwing away the data, Román and Stokes wracked their brains for any other reason city lights would change that much. In general, VIIRS was a much more powerful instrument than previous sensors. Its Day/Night Band could capture much finer detail than the widely used DMSP nighttime-light datasets. Once VIIRS' Day/Night Band was up and running, its images would ultimately have pixels that were closer to the size of two city blocks (compared to DMSP’s mile-and-a-half-long pixels). Barring a major malfunction, the evidence suggested that urban light levels were indeed changing; Román and Stokes just had to figure out why.
Ultimately, it was a calendar that helped crack the case. The variations were most apparent in cities across the Middle East and North Africa, and the spikes consistently aligned with Islamic holidays, including the Holy Month of Ramadan and the celebration of Eid. During these times, Muslims break their fast after sunset, so daily life shifts to the night, illuminating neighborhoods after dark. The pattern stayed true across the Middle East, though it varied by country and region.
Curious if the pattern would hold true for different holidays, Román and Stokes looked at data from the Christmas season. Sure enough, they saw spikes in the U.S., Canada, and Europe. Holiday lights were making the cities 20-30% brighter at night than the rest of the year; suburban and rural areas sometimes jumped to 50% brighter.
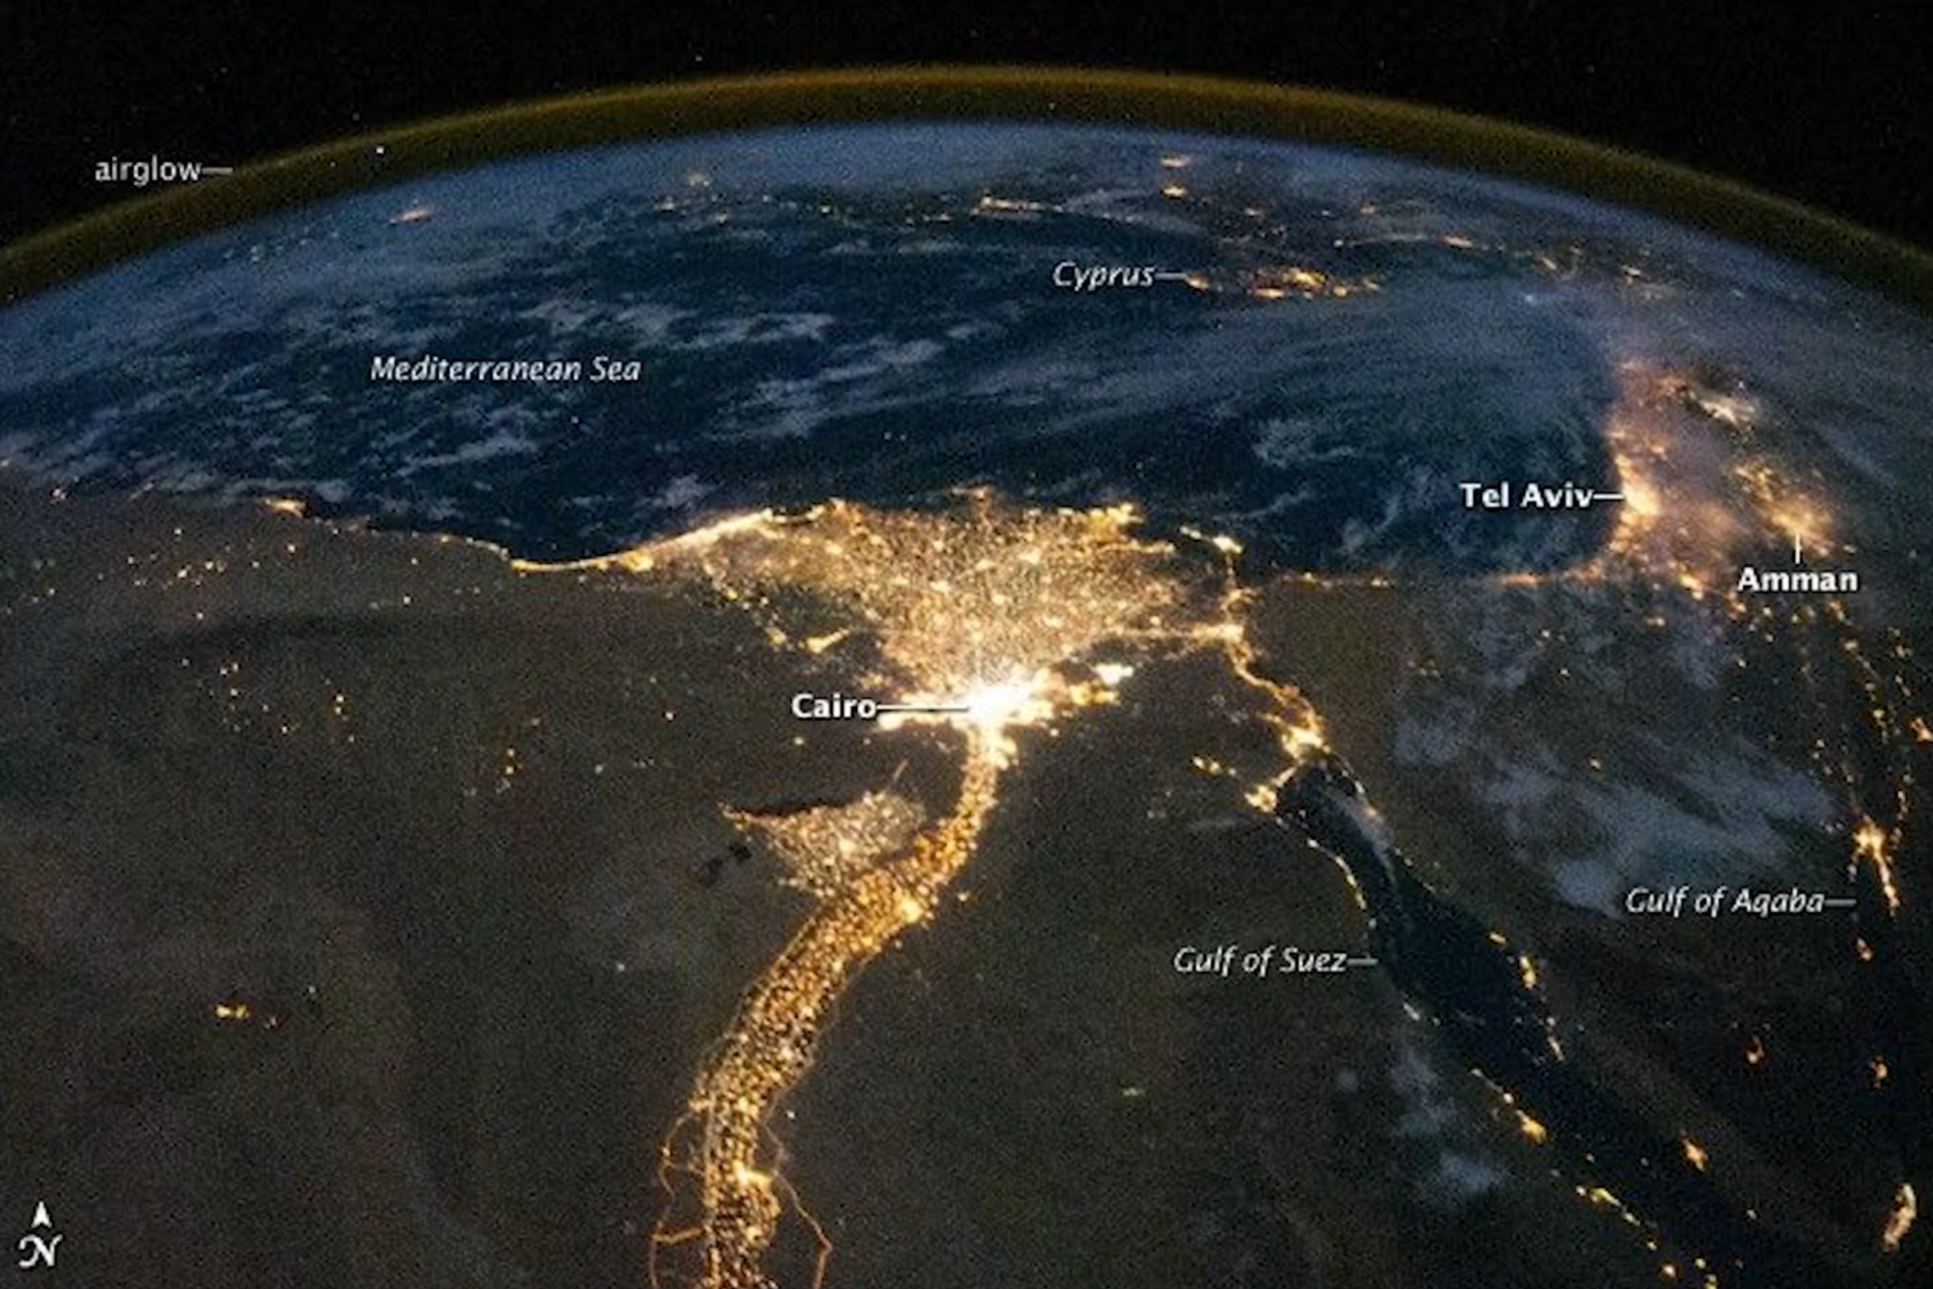
Nile River Delta at night (NASA)
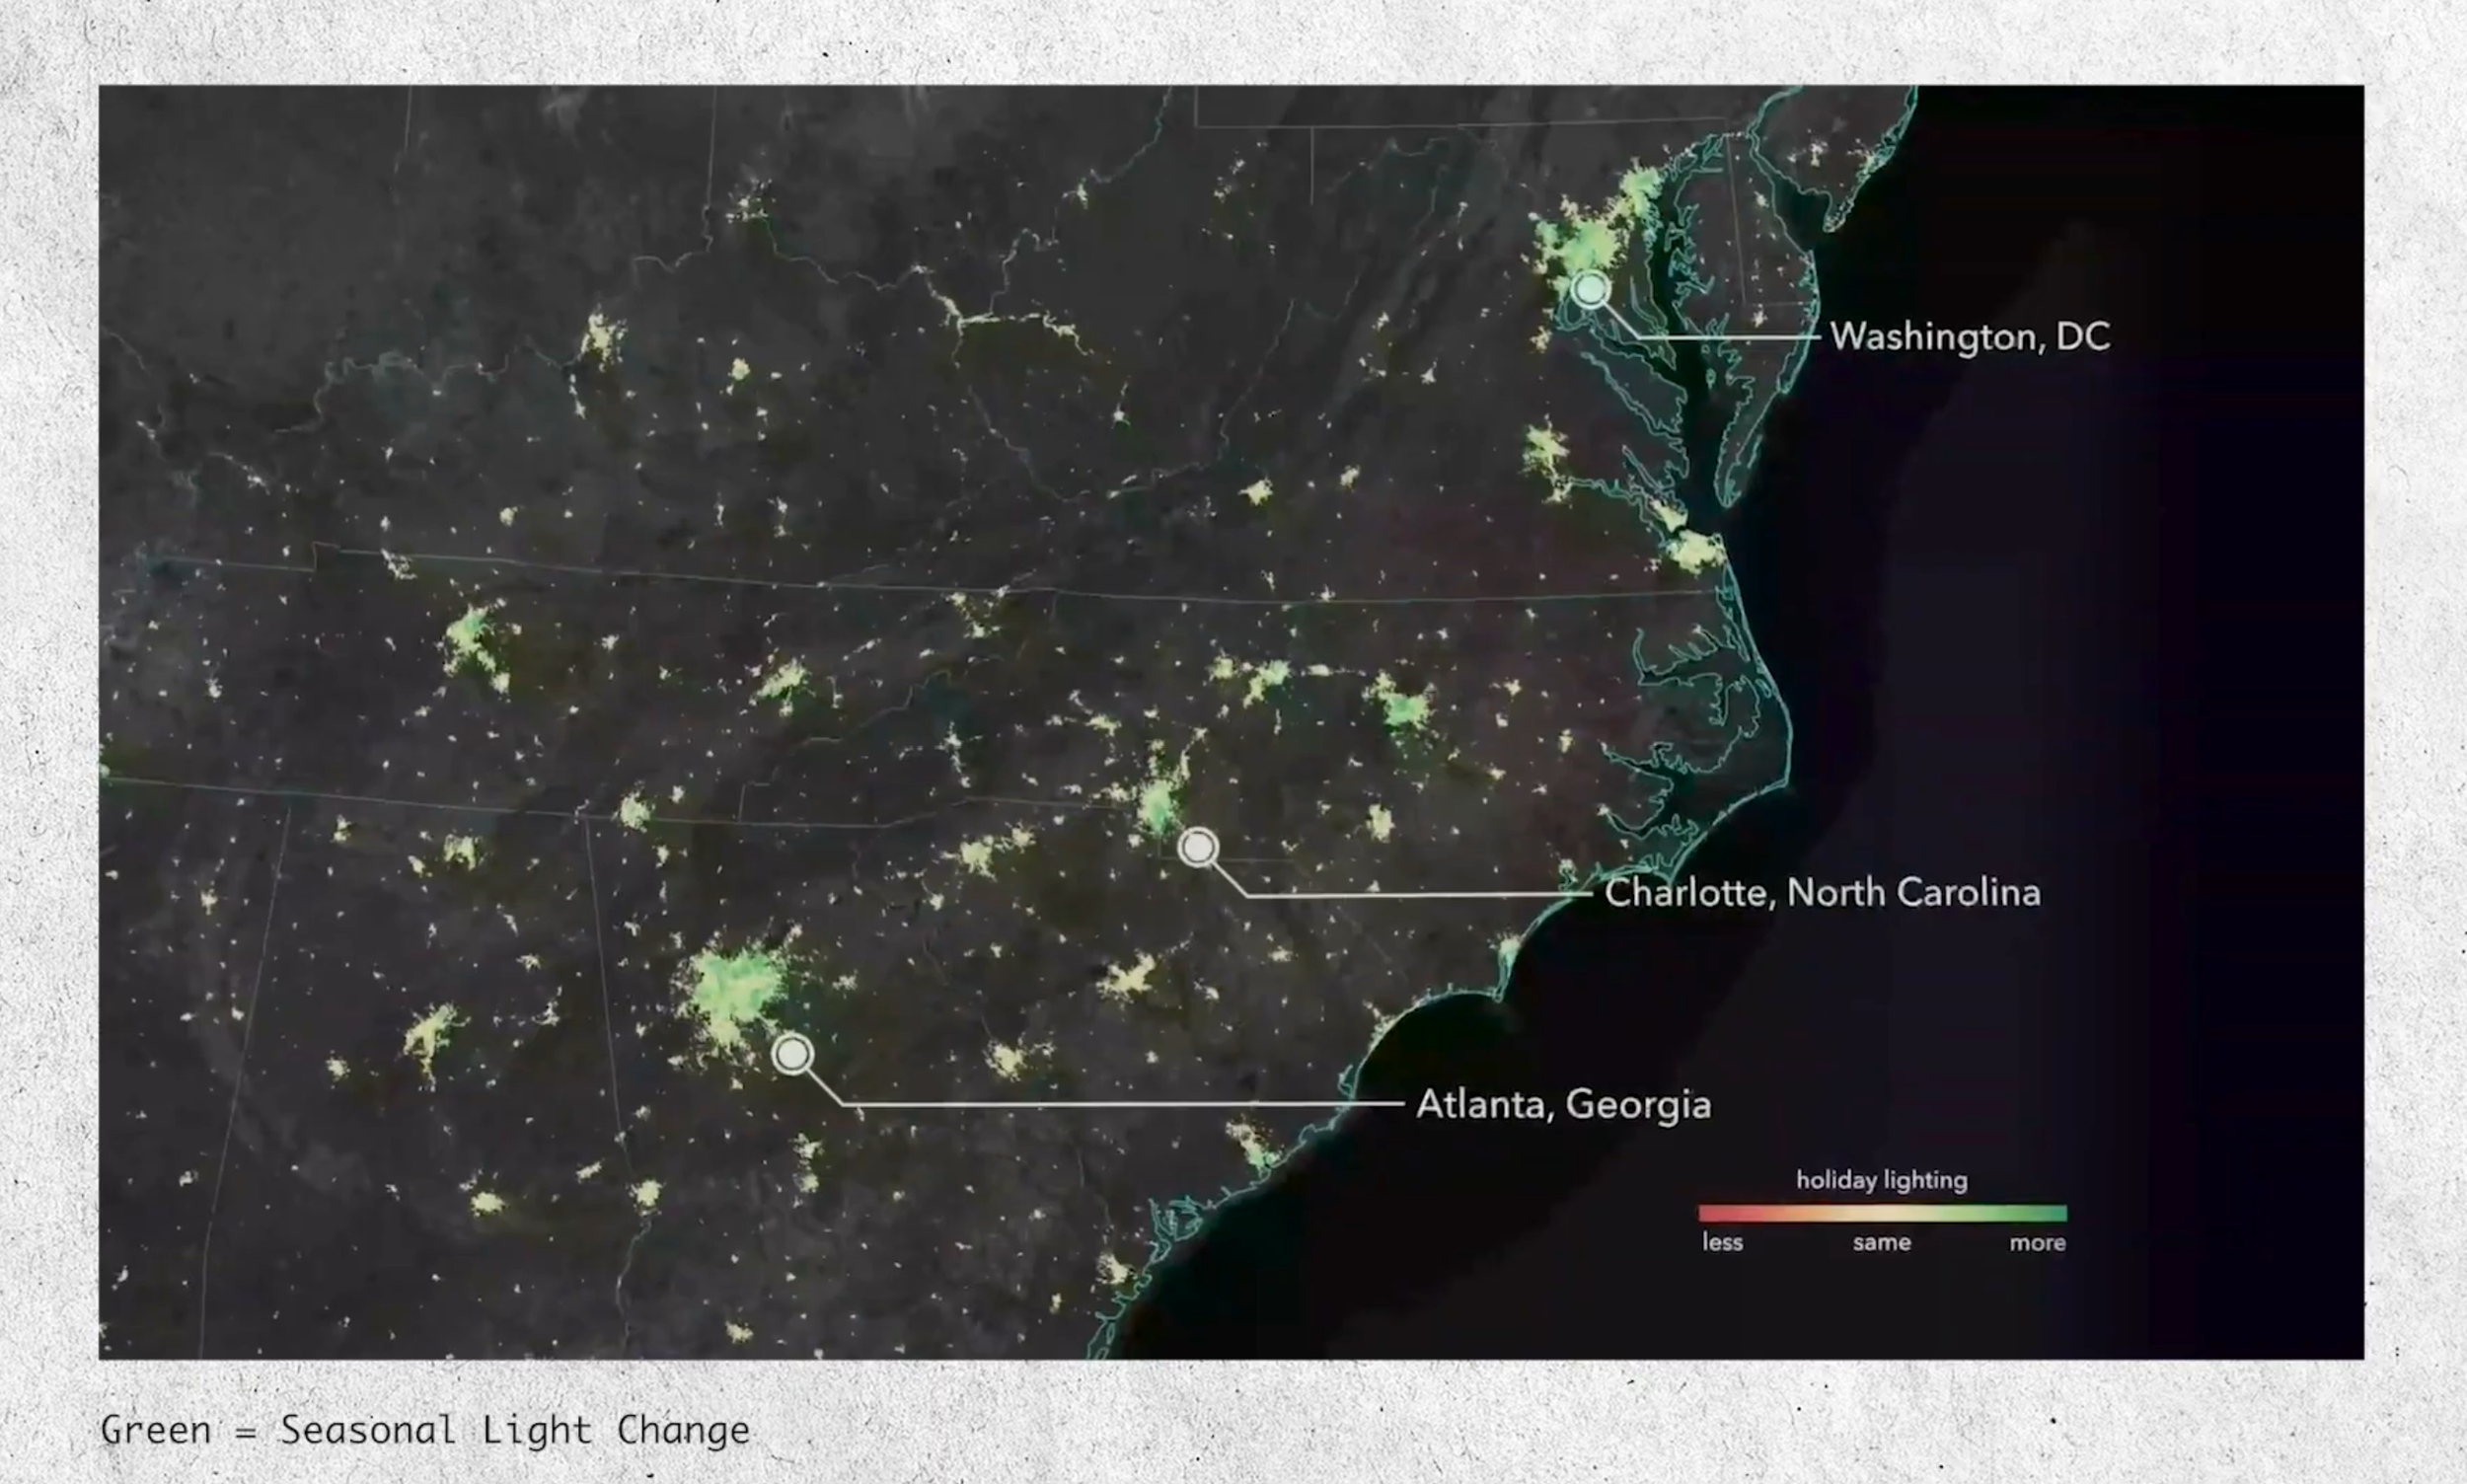
Holiday lights in the U.S. (NASA)
It began to sink in — VIIRS was sensitive enough to detect the subtle changes created by seasonal and holiday lights, all the way from space. No one had anticipated that a meteorological satellite could reveal variations in human activity at such a fine scale.
Building NASA’s Black Marble
The data still required major processing before it was usable, from removing cloud cover to adjusting for changes in moonlight. Román and Stokes turned to their colleagues: Virginia Kalb, a mathematician and data analyst, and Zhuosen Wang, a geographer.

Virginia Kalb
Kalb had worked at NASA for years, where, according to her colleagues, she quietly but routinely performed incredible feats of problem solving for teams across the agency. For this project, she needed to convert raw data from the satellite sensor into a format that could be used for maps. This is harder than it may seem — Earth is spherical, so satellite imagery doesn’t transfer cleanly onto a flat grid. Kalb mapped raw data from the satellite’s swath of coverage to “tiles” of a consistent size (10 degrees latitude by 10 degrees longitude). Next, she had to identify which data to use. Satellites can pass over the same location several times a day, collecting multiple snapshots of the same observation point. The best versions were ones that had the least amount of cloud cover and the optimal angle of the satellite, where the sensor’s line of sight was straight down, close to a 90-degree angle to Earth. Only then could the team begin processing the data to filter out moonlight, clouds, and other interference.

Zhuosen Wang
Wang came to the U.S. to pursue a Ph.D, at Boston University, where he met Román. The two reconnected when Wang came to Goddard as a postdoctoral fellow. Wang was the key to cracking the algorithm that would remove moonlight from the VIIRS data.
This was not simply data cleaning. It required reconstructing the journey of light itself: sunlight reflecting off the moon, illuminating Earth’s surface, and finally traveling back to the satellite sensor. Throughout the month, moonlight reflects off Earth at different angles and intensities; a full moon reflects much more light than a crescent moon. Because of these fluctuations, researchers had traditionally used images from only part of each . Wang’s goal was more ambitious: to make nighttime light data usable on a day-to-day basis.
Then, there were the physical barriers. Clouds and tree cover obscured city lights, so Wang developed a dedicated set of algorithms to get around the obstructions. Even snow on the ground impacted the readings, intensifying the amount of light reflecting to the satellite. Wang addressed that, too.
The data collected by VIIRS and processed by the team was leaps and bounds ahead of anything researchers had previously obtained. Says Stokes, “It [was] like putting glasses on for the first time.” The suite of algorithms came together to create a tool that the team named Black Marble, an homage to the Blue Marble image.
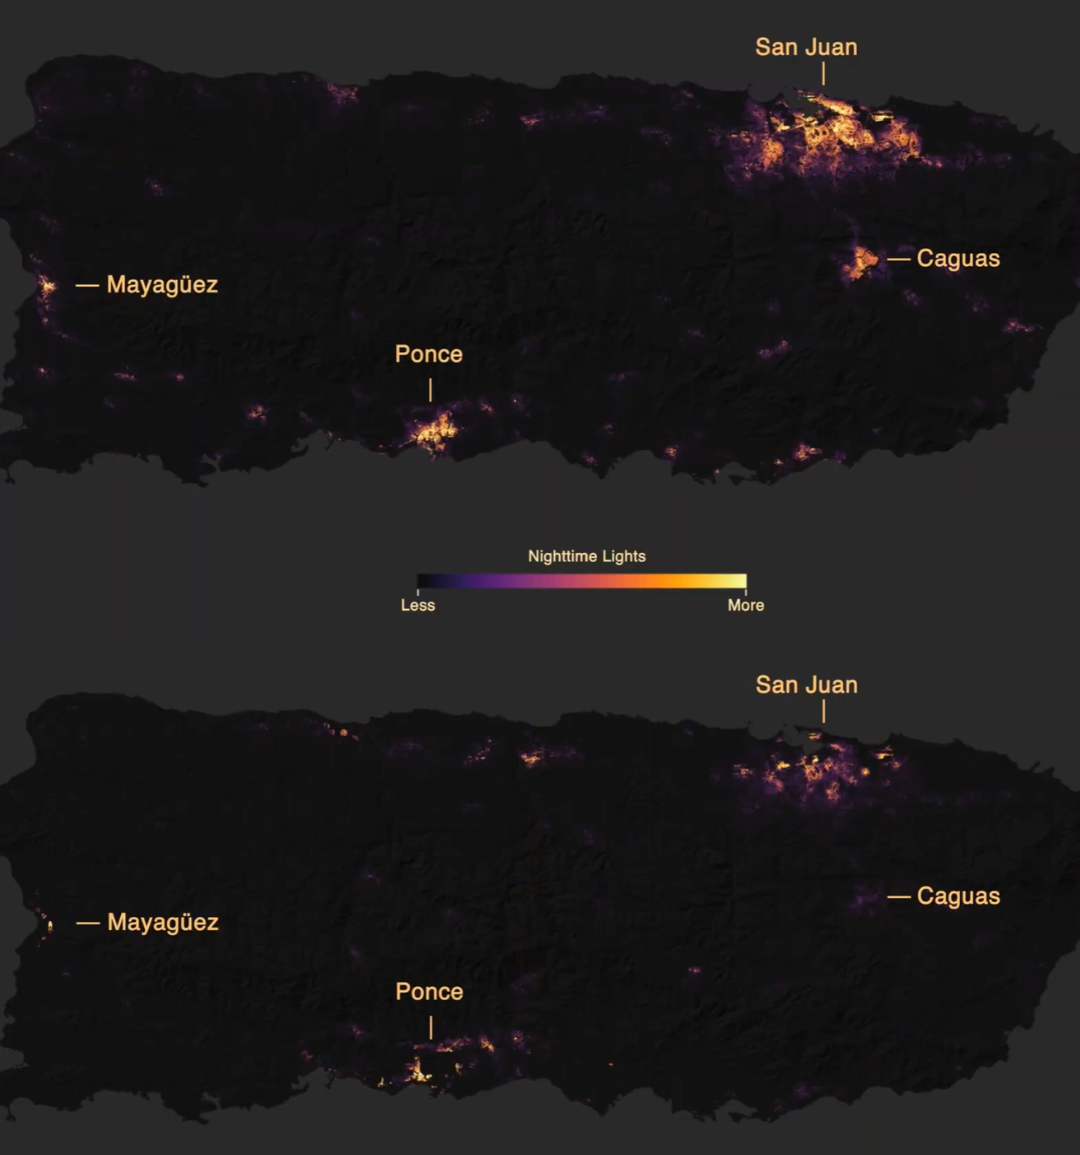
Puerto Rico’s nighttime lights before and after Hurricane Maria made landfall
Ready for Takeoff
As they worked to prepare this tool, hoping that it could shed light on human activity, Román and his team prioritized making the science open and publicly accessible. Their efforts evolved beyond producing compelling nighttime imagery into creating a suite of trusted data products designed for long-term use and broad public access. The opportunity to put that data to use arrived sooner than they expected.
In 2017, Hurricane Maria struck the Caribbean, smashing into Puerto Rico and neighboring islands, including Dominica and the U.S. Virgin Islands. In Puerto Rico, catastrophic damage from high winds, heavy rainfall, and flooding destroyed the island’s power grid, resulting in one of the longest and largest electrical blackouts in U.S. history. Data from Black Marble showed where blackouts existed, followed by when and where the power returned. Suddenly, the team’s theoretical work had a major, direct application.
Wang recalls, “It’s the first time I realized my work is not just the science; it can help people.” For Román, it was very personal — like many Puerto Ricans living on the U.S. mainland, he was supporting family in Puerto Rico while doing his job, as he was helping apply Black Marble’s observations to disaster response and recovery efforts.

Ranjay Shrestha
This was a meaningful proof of concept, but the team was still working on making NASA’s Black Marble a practical tool for decision makers, who need clear data on a fast timeline. So, they brought in a connector. Ranjay Shrestha, a satellite geoscientist, joined the team just prior to when the team developed the standard Black Marble product. Shrestha worked on how the tool could be applied, how to support the people who would be using the data, and the outreach that would make sure the tool was actually useful.
That work paid off. During Hurricane Ian’s landfall in Florida in September 2022, data from Black Marble tools were ready to go. By comparing pre- and post-storm light levels, the team could map blackouts and track how power returned over the following days and weeks. The observations provided an independent, neighborhood-scale view of widespread power disruptions and recovery that helped inform damage assessment and response planning.
Working with NASA’s broader disaster response programs, Black Marble started supporting federal, state, local, and other response partners. During the May 2024 derecho in Texas, for example, Black Marble maps revealed the extent and persistence of power outages across the Houston region as nearly a million homes and businesses lost electricity and had to withstand dangerous heat that followed the storm. Black Marble gave policymakers insight into where services failed during major disasters and how they might fix the issues in the future.
Global Satellite, Global Impacts
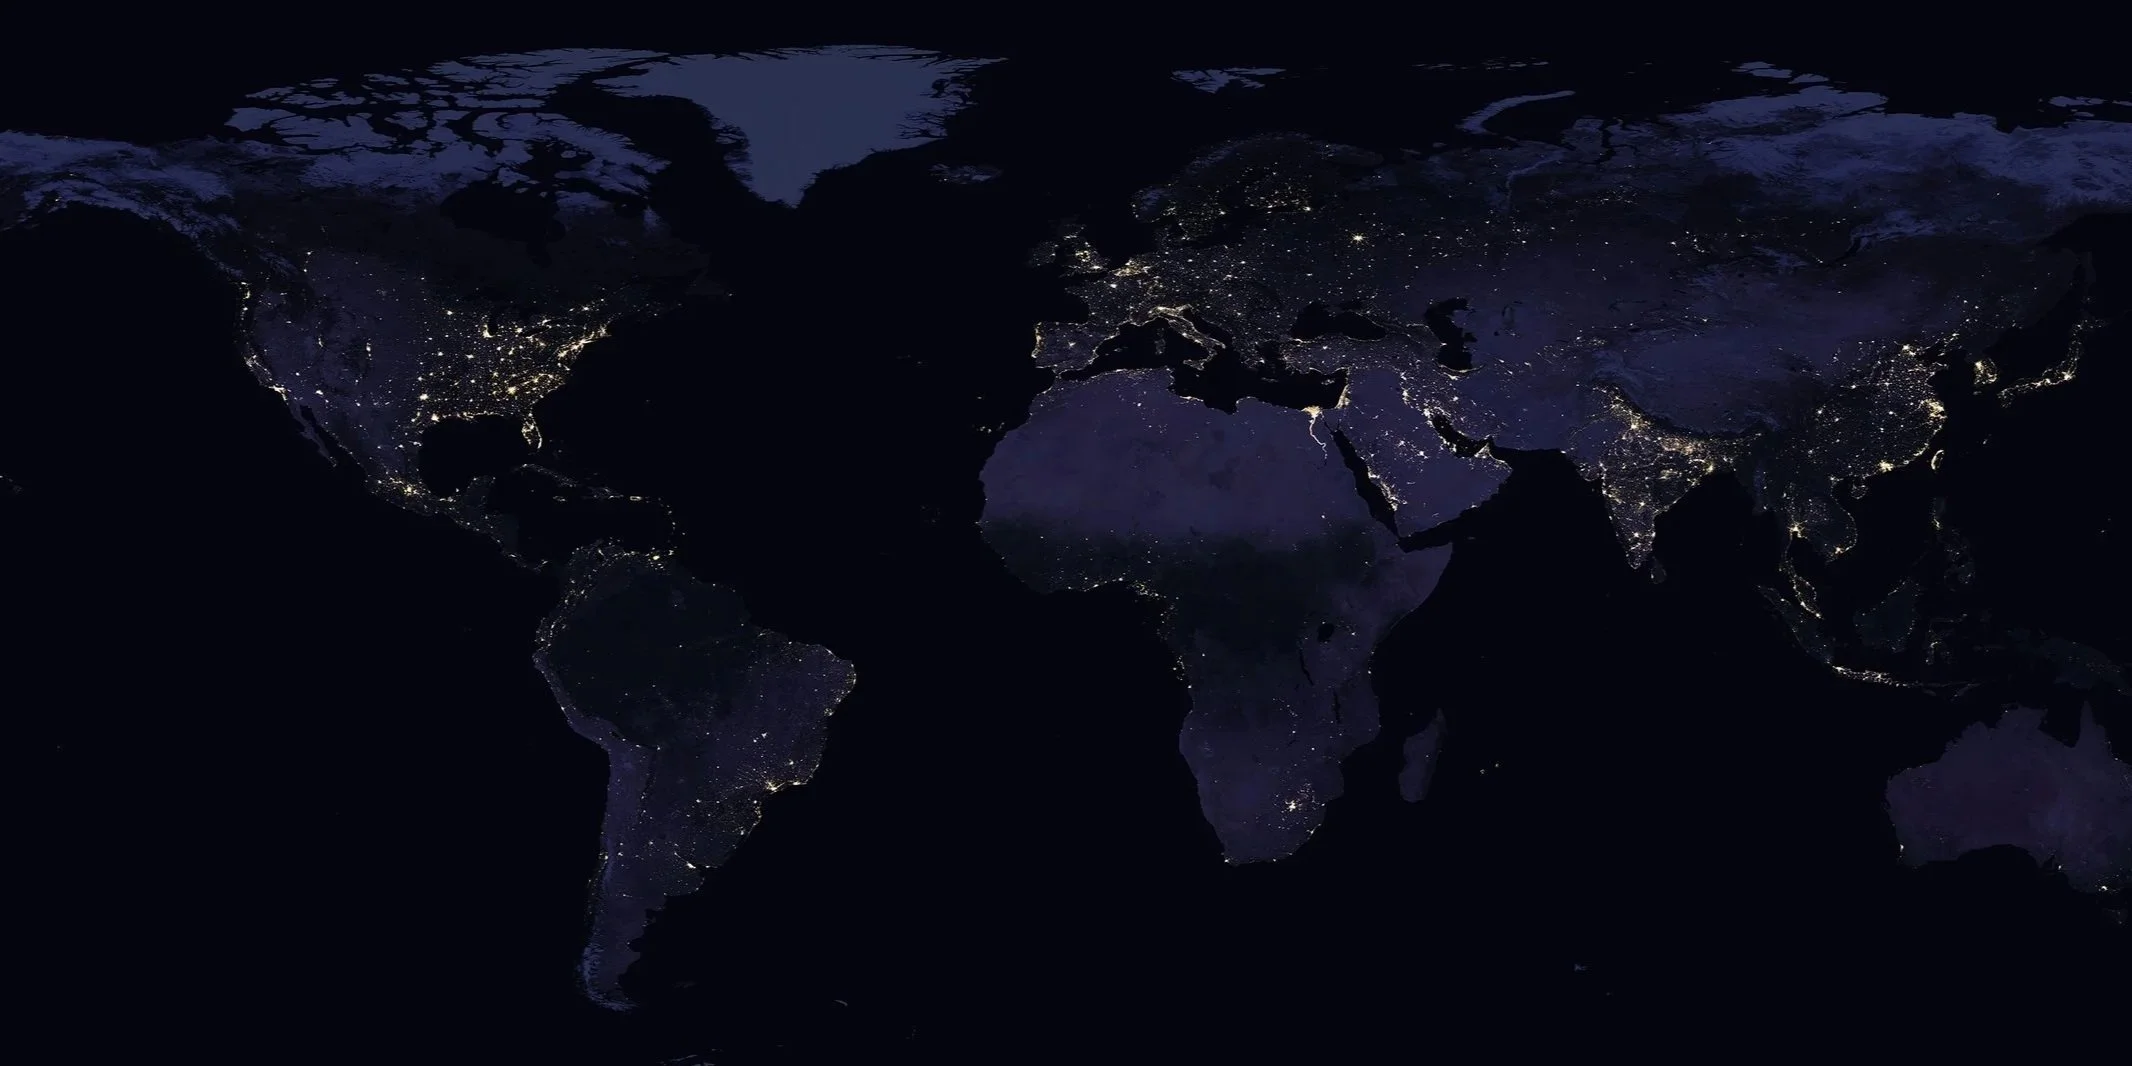
The technology built based on the Black Marble team’s research has opened up a new way of looking at Earth — not just mapping where human infrastructure exists but how humans use it. By understanding the baseline of normal rhythms of human communities, scientists can identify unexpected deviations. Black Marble has been able to spot illegal shipping lines and illegal fishing, track how cities grow and change, and provide estimates of where people have lost access to basic services in conflict zones, helping inform humanitarian relief agencies.
With just a few clicks on NASA’s Worldview portal, scientists, emergency managers, and the public can explore daily nighttime imagery, with many products available within hours of observation. And the data itself is openly accessible via NASA’s Earthdata Search. Together, these systems have enabled data to be readily discovered, explored, and used by communities well beyond the original research team. More than a hundred million images have been downloaded, a testament to how widely this publicly funded, accessible dataset is used.
Black Marble was even useful during the COVID-19 pandemic. Nighttime images showed highways and cities dimming after travel restrictions were imposed in late January 2020. As the pandemic spread, decision makers needed timely information about community responses to lockdowns, curfews, and school closures, and traditional data sources were not keeping up with the demand. Surveys took a long time; traffic counts covered only parts of the population; and cell phone records raised privacy concerns. By comparing pre-pandemic data to current data, the Black Marble team could see where human activity dropped sharply or stayed consistent — all at a neighborhood level that didn’t infringe on individual privacy. Seeing the utility, NASA’s Science Mission Directorate created a rapid response project that used Black Marble to produce COVID-specific maps and indicators for decision makers.
The team continues to look for ways to improve and more ways to use the data. Wang is refining cloud removal algorithms, and Kalb is investigating the Northern Lights and other aurora phenomena. One of the newer members of the lab, Srija Chakraborty, is using machine learning to automate the system, so it can automatically detect changes in light. This is the sort of work that captures the imagination. Says Stokes, “It's beautiful data. It's surprising.”
The key to Black Marble was not a single grand experiment. It was sustained federal investment in the satellite missions, data systems, and teams necessary to transform early-stage research into a lasting resource that was ready to go when it was needed the most. And it was a team of researchers who pursued an unexpected finding from seasonal spikes in holiday lights, carrying it from discovery, to trusted data, and ultimately, to action.
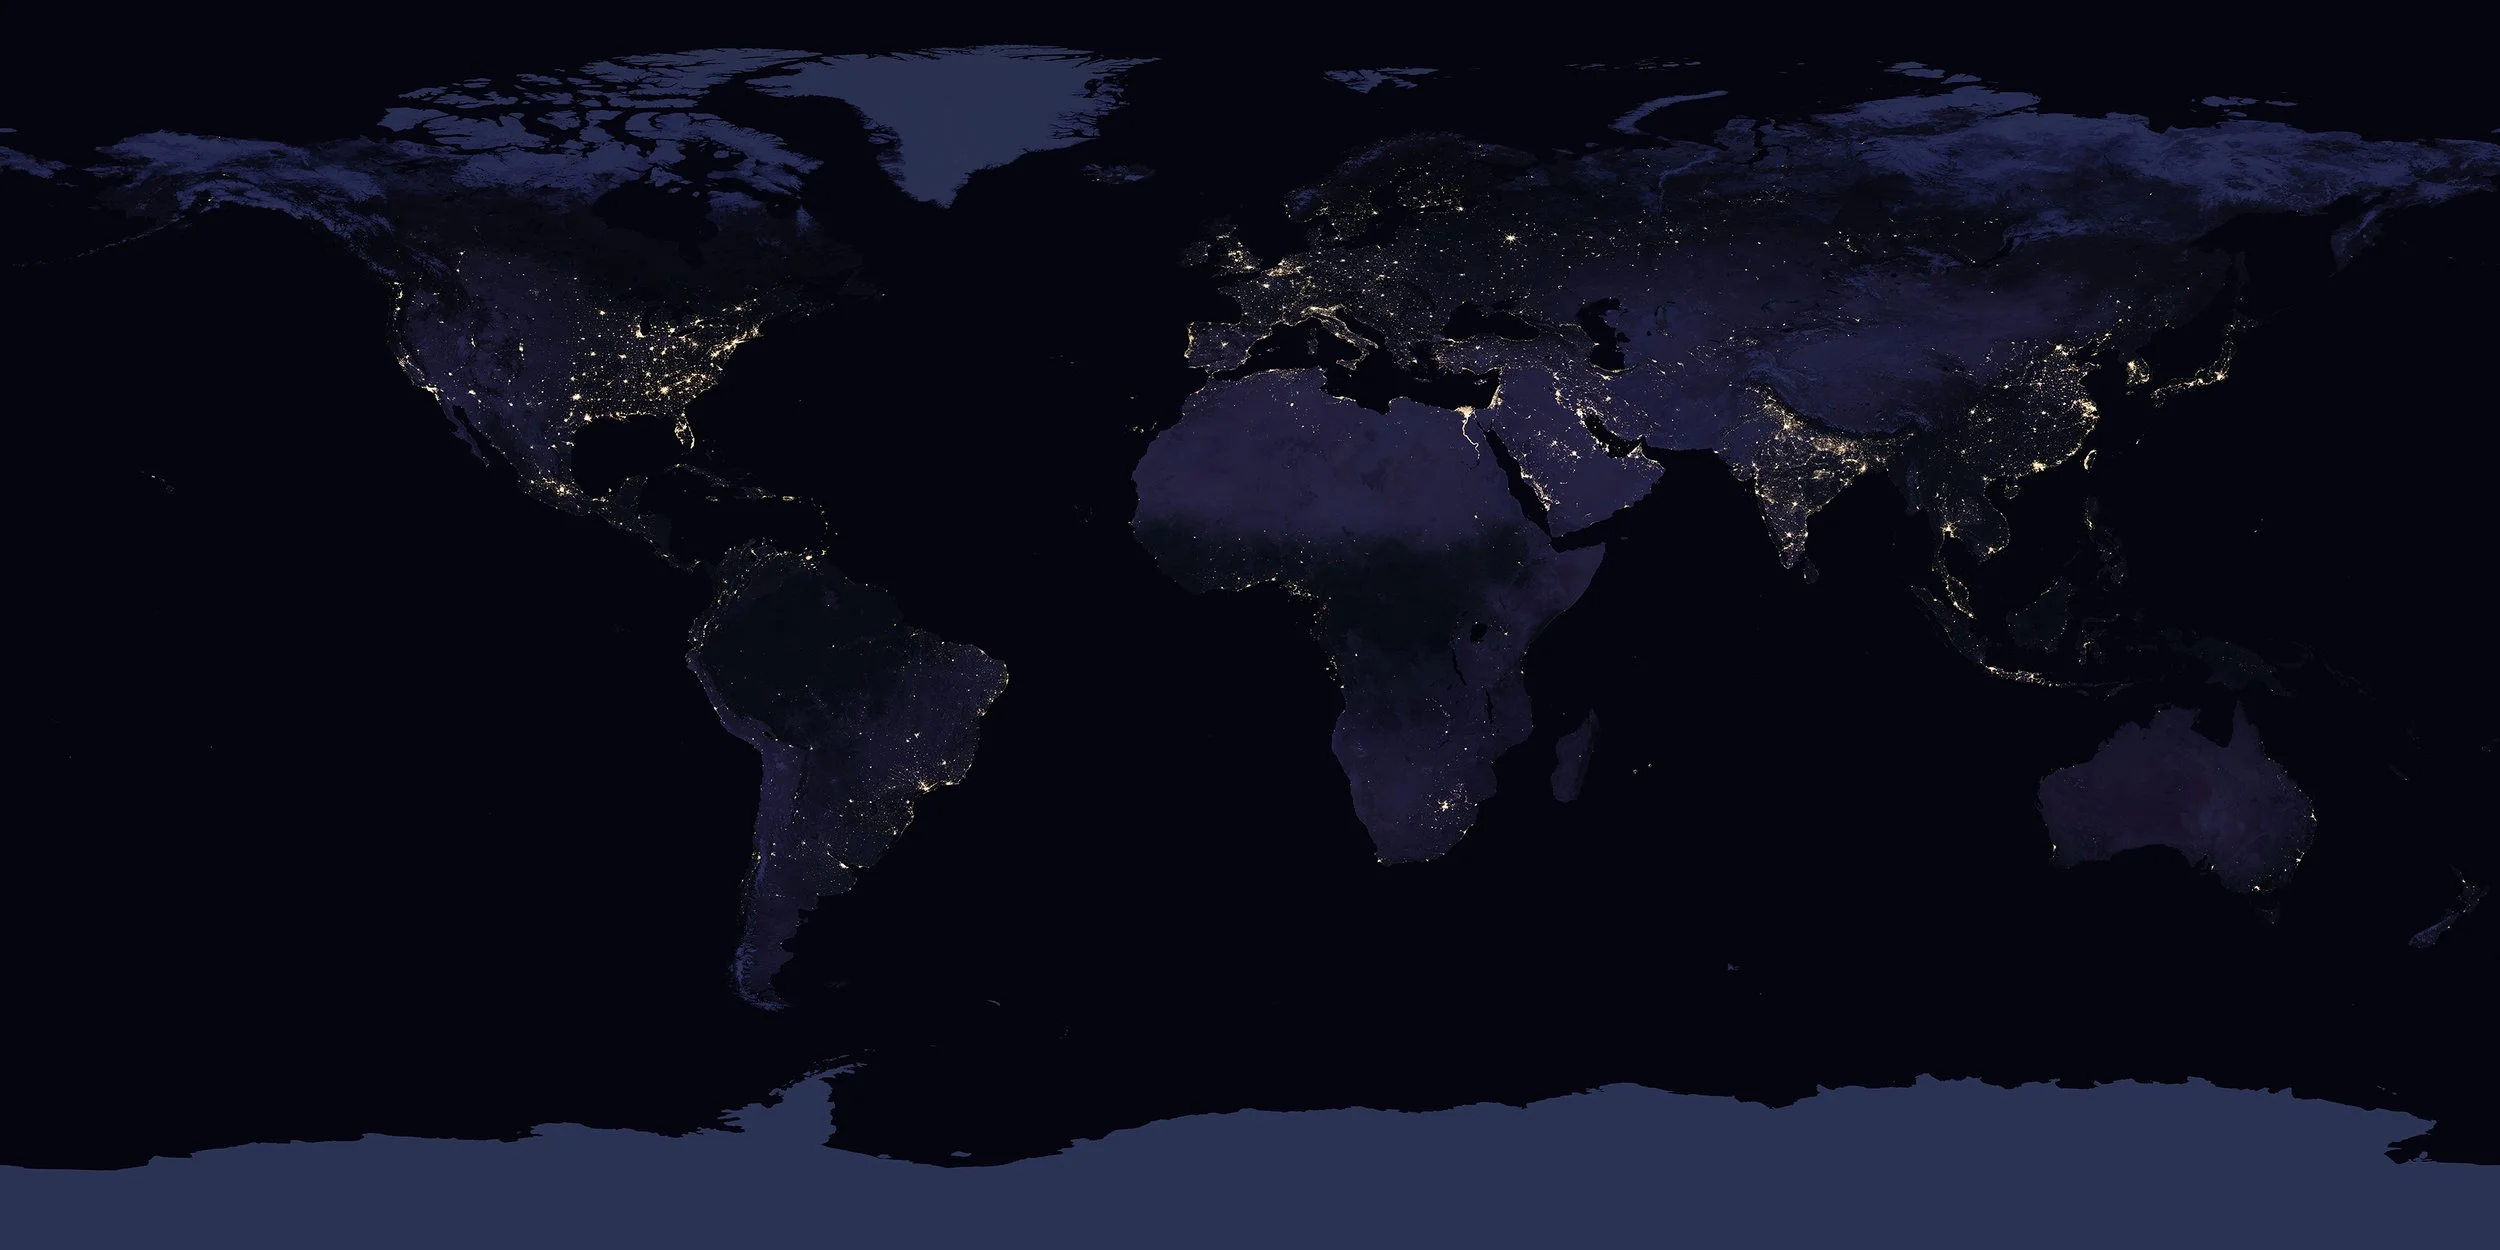
Earth’s nighttime lights as observed in 2016 (NASA’s Black Marble)
By Gwendolyn Bogard